

 Measuring very small signals can be challenging, as the ability to see them is affected not only by oscilloscope noise but also by its configuration and the probe used. The seven techniques described below can help you view smaller signals with your oscilloscope than you have seen before.
1. Start with an oscilloscope that has a low noise level.
While the oscilloscope manufacturer doesn't affect the other techniques described for viewing small signals, having an oscilloscope that offers a low noise level is essential for gaining visibility of small currents and voltages. You won't be able to see signal details smaller than the oscilloscope's noise level.
How can you quickly check the noise level of a specific oscilloscope? Most oscilloscope manufacturers characterize the noise level of each model and include this value in the product data sheet. If this isn't the case for your oscilloscope, you can request this information from the manufacturer or find it out yourself. Measuring it only takes a few minutes. Disconnect all the front panel inputs from the oscilloscope and set the oscilloscope's input path to 50 W. You can also perform the test with a 1 MW path. Enable a good amount of acquisition memory (between 100 kpts and 1 Mpts), use the oscilloscope with infinite persistence, and observe the thickness of the resulting waveform. The thicker the waveform, the more noise the oscilloscope is generating internally.
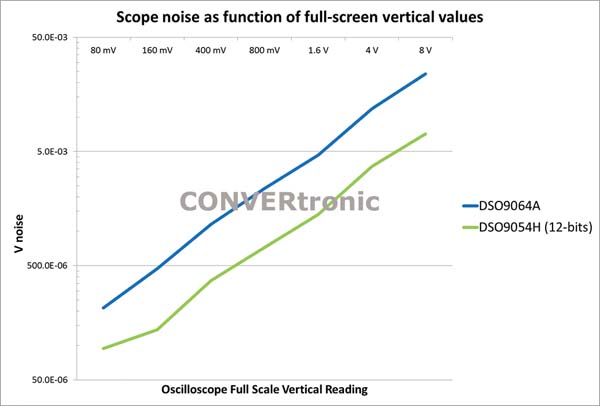
Each oscilloscope channel will exhibit a unique noise quality for each vertical configuration. You can examine the noise visually by observing the waveform thickness, or you can take a more analytical approach by performing an AC measurement of Vrms to quantify it. Create a graph like the one shown in Figure 1. These measurements will allow you to determine the noise generated by each oscilloscope in the various vertical configurations. Obviously, you will not be able to measure signals lower than the oscilloscope noise floor.
Currently, several oscilloscopes on the market offer more than 8 bits of resolution. What value do these extra bits provide? Provided there is a sufficient signal-to-noise ratio (SNR), the higher the number of bits in the analog-to-digital converter (ADC), the finer the signal details that can be seen. Noise is usually one of the main factors attributed to limiting the effectiveness of additional bits of resolution.
 2. Enlarge the waveforms to achieve maximum ADC resolution
. Resolution is the minimum quantization level of the oscilloscope. An 8-bit ADC can encode an analog input into 256 different levels, since 2⁸ = 256. The ADC acts on the oscilloscope's full-scale vertical value. Therefore, the Q-level steps are associated with the oscilloscope's full-scale vertical setting. If the user sets the vertical setting to 100 mV per division, the full display corresponds to 800 mV (8 divisions * 100 mV/div), and the Q-level resolution is equal to 3,125 mV/level (800 mV divided by 256 levels).
Enlarging the waveform to fill the entire oscilloscope screen allows you to take better advantage of the internal ADC. If you enlarge a signal to fill only half the vertical screen, the number of ADC bits used drops from 8 to 7. If the signal is enlarged to only a quarter of the vertical screen, the number of ADC bits used drops from 8 to 6. To utilize all 8 bits of the oscilloscope's ADC, enlarge the waveform to fill the entire vertical screen. While keeping the waveform on screen, use the most sensitive vertical scaling setting.
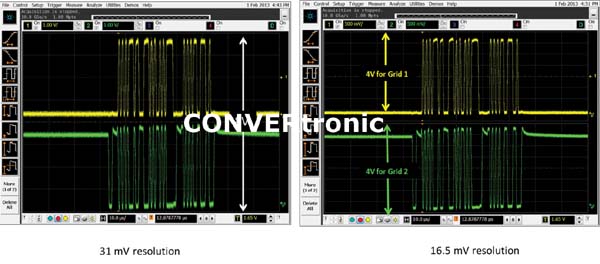
Many oscilloscope vendors offer users the option of adding multiple grids to the instrument. The goal is to allow users to view individual waveforms instead of overlapping ones. One or more waveforms can be placed and magnified on each grid, making it easier to view the oscilloscope screen. With a grid like the one shown in Figure 2, each waveform can be magnified to its full-scale vertical value.
Can small signals be viewed with a higher-bit ADC? Theoretically, yes. In practice, oscilloscopes with 12-bit ADCs exhibit noise levels at the lowest quantization levels. Consequently, the 4,096 available levels cannot be fully utilized, as the least significant digits are simply quantization noise. 8-bit ADCs using high-resolution mode achieve noise levels similar to those of oscilloscopes with 12-bit ADCs. This is because the quantization noise is masked by the oscilloscope's input noise.
 3. Take full advantage of the oscilloscope's off-screen dynamic range specification.
Zooming in on a waveform to utilize the full 8-bit scale of the oscilloscope's ADC is a good idea. But why not zoom in even further? If too much of the signal remains above or below the vertical limits of the oscilloscope's display, the ADC will saturate. When saturated, the ADC stops providing valid readings. The oscilloscope requires an unspecified amount of time to recover from saturation, and measurements taken during this recovery time are invalid.
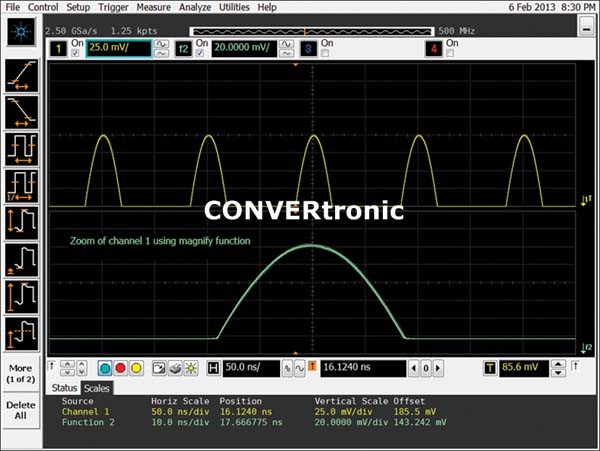
Oscilloscope vendors specify an off-screen dynamic range. This value is typically expressed as the number of divisions a signal can fall above or below the screen limits without causing oscilloscope saturation. This technique provides users with additional vertical zoom to apply more vertical resolution to the portion of the signal displayed on the screen. Figure 3 shows an example where the user was about to double the vertical resolution by shifting the signal 4 divisions off-screen and then adjusting the vertical settings to double the resolution.
 4. Use mathematical functions such as magnification to enlarge the vertical display.
Once you have used the maximum number of bits of the oscilloscope's ADC, the next step is to magnify the event under
study.
For signals with a high dynamic range, it's useful to create a function that magnifies the portion of the waveform you're interested in.
Almost all modern oscilloscopes are equipped with one or more mathematical functions, or allow you to enlarge windows so that the enlarged window includes independent vertical and horizontal scales from those of the main window.
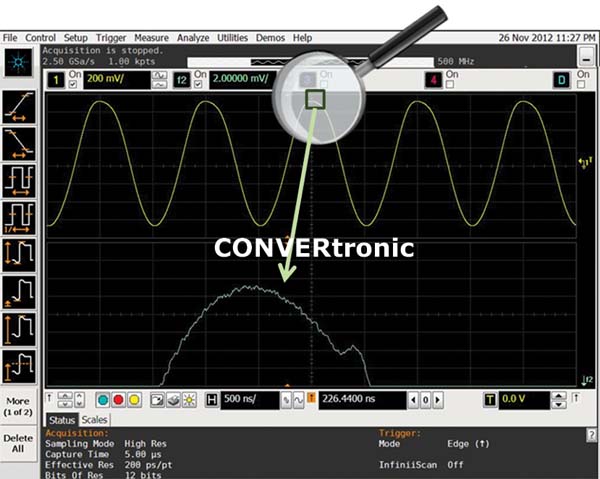
For example, to enlarge an image using a function, assign a function that magnifies channel 1 of the oscilloscope. The user can change the position and scale of the magnification function as shown in Figure 4. In this way, the main window displays the entire waveform, while the magnification function enlarges the area under study. The mathematical (zoom) function will not offer better resolution than that generated by the oscilloscope with the channel's waveform, but enlarging it will allow you to see details that would have been impossible to observe in the full waveform.
 5. Use High-Resolution Mode to Reduce Noise.
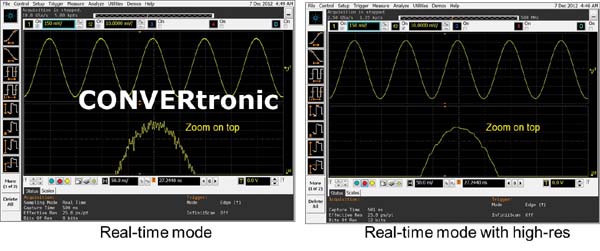
All leading vendors offer oscilloscopes with a high-resolution mode. This mode increases the resolution bits while reducing noise. In this mode, the ADC oversamples and then applies a filter. A boxcar filter is typically used to average the intermediate oversamples. On many oscilloscopes, high-resolution mode allows the user to specify the resolution bits, which will determine the length of each boxcar filter. For example, if high-resolution mode is enabled on an oscilloscope with an 8-bit ADC and set to 11 bits, each boxcar will consist of 8 (2³) ADC sample points.
A DSP boxcar filter averages the samples and stores the resulting average vertical value in the oscilloscope's acquisition memory as the sampling rate displayed on the oscilloscope screen. This technology statistically eliminates a significant portion of the oscilloscope's internal noise, as shown in Figure 6. The most important attribute of high-resolution mode is its ability to reduce the oscilloscope's overall noise. High-resolution mode can reduce the oscilloscope's internal noise by a factor of three.
The drawbacks of high-resolution mode are reduced bandwidth and decreased performance. Because the oscilloscope has to perform more processing tasks with the DSP filters, the refresh rate is reduced.
 6. Limit the bandwidth to reduce noise.
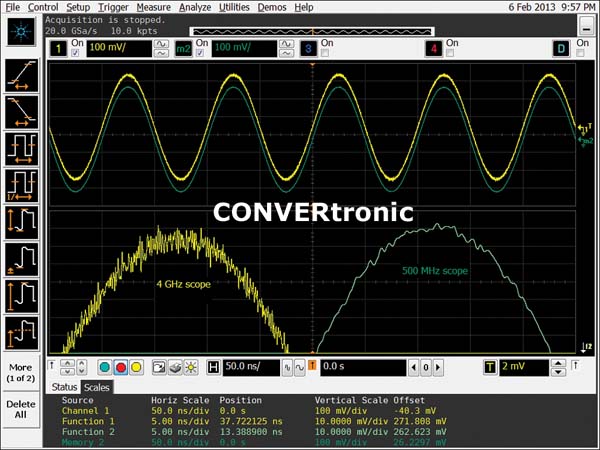
Reducing the oscilloscope's input bandwidth eliminates broadband noise that can impair the oscilloscope's ability to display small signals. Ideally, you should set the bandwidth to only 1 Hz above what the oscilloscope requires. If all other specifications are identical, when viewing a 10 MHz sine wave signal, an 11 MHz oscilloscope will perform better than a 50 GHz oscilloscope. Why? Because a higher bandwidth introduces more broadband noise.
Many oscilloscopes are equipped with bandwidth adjustment parameters. To view small signals, minimize oscilloscope noise by setting the bandwidth to the lowest value that meets your measurement criteria. If your oscilloscope does not offer adjustable bandwidth, another technique for limiting bandwidth is to use high-resolution mode.
Otherwise, the oscilloscope will allow you to choose between limiting bandwidth via hardware or software. Hardware bandwidth limiting is recommended, as this maintains the oscilloscope's responsiveness, whereas software-based techniques involve additional processing.
 7. Calculate the Average When Signals Are Repetitive.
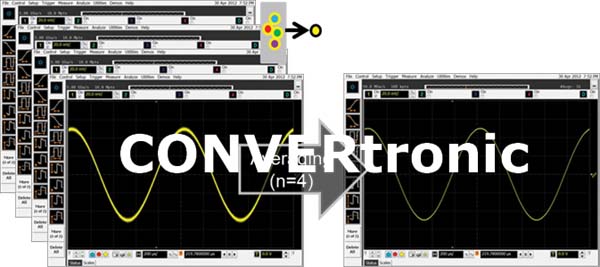
Oscilloscopes incorporate another mode called averaging. Enabling averaging causes the oscilloscope to calculate the average of the vertical values of each captured waveform with the vertical values of successive waveforms. Oscilloscopes allow the user to specify how many waveforms to average. Averaging is another technique that allows users to reduce oscilloscope noise. Unlike high-resolution mode, which employs oversampling techniques, averaging does not work with single-shot acquisitions. Averaging requires a repetitive signal and will detect any infrequent anomalies. This technique reduces oscilloscope noise and allows for better visualization of small signals.
Author:
Author: Joel Woodward, Senior Product Manager, Oscilloscope Division, Agilent Technologies