
Challenges for Manufacturers:
Running a profitable manufacturing business is becoming increasingly difficult. Costs and revenues are constantly under intense pressure, while fierce competition, both locally and globally, means margins are tight and there is little room for error.
Data generated by automated assembly equipment can provide answers to manufacturing challenges. Every time a jig is loaded, a scrap cutting sheet passes, a nozzle picks up and places a component, and an assembly is inspected, sensors such as position sensors, force sensors, nozzle-mounted cameras, and inspection cameras capture information that intimately describes the condition of the assembly equipment, the stability of processes such as screen printing and component placement, and the characteristics of the components and materials that determine product manufacturability and end-of-line performance.
Capturing this data is a hurdle. Converting raw data into actionable information to solve problems and improve end-of-line measured results has been largely left to SMT line management software. Until now.
Several line management packages, such as Yamaha's Factory Tools suite, have helped operators, production supervisors, and planners exert control over online SMT equipment and, therefore, improve utilization, efficiency, and productivity. They typically include tools to assist with machine scheduling and line balancing, and to monitor production in real time. Line monitoring software like Yamaha's M-Tool allows managers to see equipment status at a glance and helps ensure that components and feeders are replenished at the right time to avoid unnecessary downtime. In addition, tools like Yamaha's QA Options and the Mobile Judgment smartphone app indicate No-Go inspection results and help identify the cause and restart production.
More Data, More Powerful Tools:
There are challenges in finding answers embedded in data. Historically, analysis has been laborious, often requiring experienced production team members to interpret the results and thus detect unwanted trends and trace the root causes of defects. This often relies on experience and a "feel" for individual machines to identify the causes of problems and anticipate maintenance issues before equipment failure occurs. Generating reports based on the captured data, which are often requested to support high-level actions such as preparing new commercial tenders, improving product designs, or guiding investments in new capital equipment, increases the workload and slows down business decision-making.
Currently, data science is in the midst of a sudden shift in development, as companies across many sectors pursuing digital transformation demand more data and more powerful analytical tools to help them understand what it means for their businesses. Many different types of organizations in sectors such as logistics, pharmaceuticals, food packaging, and banking are establishing their own data cultures to uncover new business insights and understand how to mitigate risks, reduce costs, increase efficiency, create better products and services, and deliver greater value for customers and stakeholders.
The latest data science is also poised to assist the electronics manufacturing community. Leveraging best practices in the emerging data industry, previously manual analysis tasks can now be automated to extract deeper insights faster and more efficiently than ever before. Yamaha has partnered with Tableau Software to introduce the Yamaha Dashboard visual suite, which incorporates Tableau analytics software. The tools available in Dashboard provide live and historical production analytics that help visualize operational quality status, analyze availability, performance, and the quality factors that constitute Overall Equipment Effectiveness (OEE), and drill down into the data to identify the root causes of problems or defects and get help resolving issues such as picking errors, line balancing problems, and other bottlenecks.
OEE Analysis:
Yamaha's Dashboard monitoring tools help operators stay on top of equipment status and quickly recover machines and production when needed, while shop floor managers and engineering staff can use the insights to manage issues strategically and take action to improve performance. At a higher level, management reporting tools provide the analysis needed to assess the current state of manufacturing capacity and inform both immediate and longer-term decision-making.
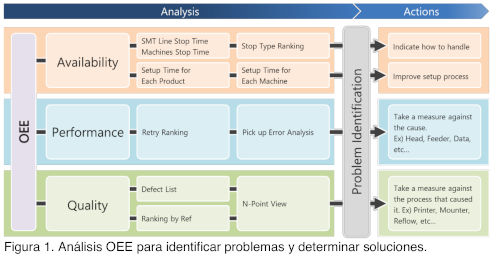
By identifying the causes of reduced availability, performance, and quality, OEE and, ultimately, productivity can be improved. The data analytics insights embedded in the Dashboard can reveal the keys to these challenges. The analysis, as described in Figure 1, can quantify problems and identify their causes, leading to decisions about the most appropriate course of action.
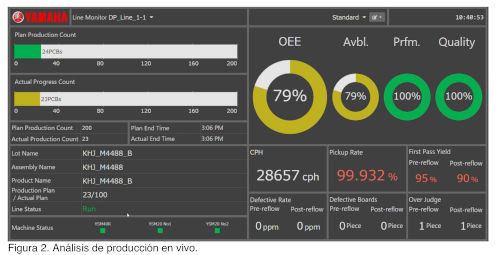 Live production analysis reports the status of machines and the line graphically and in detail, as shown in Figure 2. Users can quickly identify any failures that occur on the production line, see which machines have stopped, and view the effects on OEE as they occur.
Historical production analysis, on the other hand, provides a direct graphical view of OEE metrics and allows users to instantly visualize downtime, setup time, and errors that cause stoppages (Figure 3). A more detailed analysis includes the number of collection errors and the events that cause the most frequent stoppages. 
Deeper Data Analysis
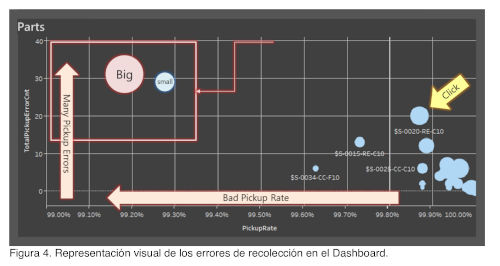
The Yamaha Dashboard contains several views that allow for deeper analysis of line balancing issues, problems causing poor component collection, and other errors. The balloon chart in Figure 4 shows how the Dashboard helps easily visualize collection statistics to identify the causes of poor performance and take steps to minimize collection errors.
Collection analysis can also help identify parts and printheads that routinely suffer from poor performance, and can highlight the results by feeder, printhead, or nozzle. Relationship analysis allows users to check the number of errors experienced with other components handled by the same feeder, printhead, or nozzle, to determine whether the error is associated with the component or the assembly.
 Adding Image Tracer:
High rejection rates often occur after visual inspection when a new type of component is introduced to the assembly line. To minimize false No-Go (NG) inspection results, a sufficient body of image data must be collected and analyzed to identify any deficiencies in the reference image used by the inspection system to recognize the component. This could take several days, after the problem is first noticed, to capture enough information from NG events to adjust the recognition image.
Thanks to the latest powerful database tools, it is now feasible to store large amounts of images associated with NG results and use them to adjust the recognition images more quickly and efficiently. Yamaha All Image Tracer is a new tool designed to continuously store all vision images and thus allows analysis as soon as a problem is detected. This can help quickly identify the causes of NG results (Figure 5) by eliminating the time traditionally needed to collect images after the problem has been discovered. With this tool, engineers can also quickly optimize reference images to avoid high false rejection rates after visual inspection.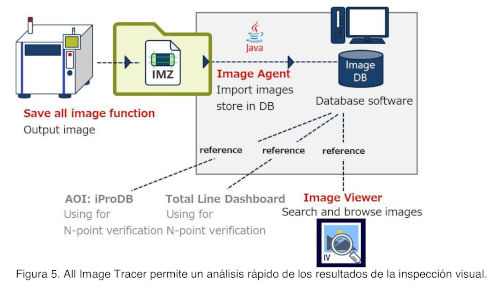
The combination of All Image Tracer with Dashboard provides additional power for production monitoring, helping to quickly identify and resolve the root causes of problems. Figure 6 shows how Yamaha's Dashboard identifies frequently occurring pickup errors, while subsequent analysis of the associated images with All Image Tracer allows for rapid identification and resolution of the error's cause by restoring the pickup height.
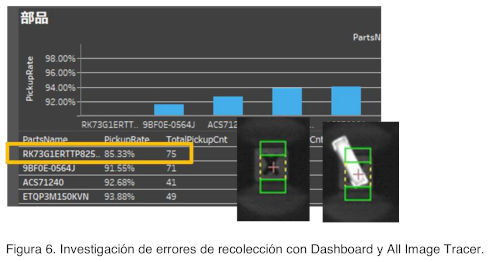 Figure 7 shows how the alignment errors detected with Dashboard are confirmed by analyzing the All Image Tracer database. A bias detected in the X-axis pickup accuracy, while the Y-axis accuracy is normal, allows the error to be eliminated by resetting the pickup position.
Conclusion: 
The Big Data revolution is happening now, and electronics manufacturing companies must leverage new analytical tools to unlock its power in their businesses.
By capturing larger repositories of data and images, and by leveraging automated analytical and visual tools to help read and understand the results, operators, plant managers, engineering staff, and management can gain the insights they need to achieve their goals. These can range from quickly recovering machines or production after downtime, to correcting errors and preventing recurrences, to making high-level decisions regarding future manufacturing strategies and product design.
Leveraging Tableau's powerful analytics platform, the Yamaha Dashboard is a scalable, future-proof tool that is ready to grow with users and the continued development of modern data science.