

Energy consumption figures for installations are typically obtained through theoretical calculations based on inventories, electricity bills, or records from a remote management system. However, what is often not so easy to determine are the lighting performance characteristics of the installations. While every installation project includes calculations for levels and other parameters, these are only verified at the end of the installation through initial testing, and there is no ongoing monitoring of these parameters over time or across the entire installation.
Obtaining measurements such as illuminance and uniformity typically requires relatively complex processes that are difficult to perform regularly or frequently, and extending their use to all installations. In other words, while energy consumption is usually known, the same cannot be said about the lighting performance of the installations.
Specifics of Vehicle-Based Measurements:
One solution to this problem is the use of a vehicle to take illuminance measurements. This speeds up data collection, making the task of measuring an entire street as simple and quick as driving along it, allowing for the study of large areas in relatively short times. Another advantage is that traffic disruptions are not necessary to take measurements on the roadway, as the vehicle can move freely within the flow of traffic.
However, there are limitations that significantly affect the comparison between the standard methodology and the methodology using a vehicle. Although practical examples and analysis of this issue show that the illuminance and uniformity values obtained by traditional methods, such as those observed by the Energy Efficiency Regulation, are not directly comparable, the average illuminance values are acceptably similar and the uniformity values obtained provide a lower bound on the actual values.
The fact that the measurements are not directly comparable to standard methods does not diminish their usefulness, as they allow us to observe variations in illuminance and the useful luminous flux provided by the luminaires. In other words, studying the behavior of the measurements over time (between different measurement sessions on different days) and along the route (within the same measurement session depending on the distance) allows us to draw conclusions about the behavior and evolution of average illuminance and uniformity, similar to those obtained through manual methods.
Furthermore, the error factor for average illuminance, between measurements on the vehicle roof and those on the ground, will be very similar over time. Therefore, in calculating the maintenance factor, which is the ratio between the initial average illuminance and the current average illuminance, this error will cancel out, and the resulting maintenance factor will be practically the same as that obtained by taking measurements on the ground.
 In summary, while vehicle-based illuminance measurement cannot provide absolute values directly comparable to those specified in the installation design, it can be useful for monitoring and tracking installation performance, the effectiveness of implemented measures, the evolution of energy efficiency, and the maintenance factor—all in a much more agile, simple, and comprehensive way.
Another point to consider is that, according to both national and international regulations and standards, most methods for measuring the average illuminance of an outdoor lighting area are based on a grid of three transverse measurement points, spaced no more than 1 meter apart, per N points along the longitudinal axis.
Integration of Different Elements:
Current systems or solutions are typically based on the integration of various components available on the market at any given time, from which custom software is developed for that solution.
This necessitates integrating and synchronizing multiple pieces of equipment from different manufacturers, with the limitations that this entails. Furthermore, if one of the manufacturers modifies or discontinues the equipment, a replacement must be found and integrated. The same occurs if the computer used needs to be replaced and has a different operating system version. Therefore, these systems often become one-off solutions that are difficult to maintain over time as a standard market product.
Furthermore, limitations in the synchronization between position and illuminance measurements, along with position update times, meant that to reduce errors and obtain measurements at uniform distances, the vehicle's reading speed had to be limited.
Therefore, based on all these premises, it was determined that the luxometric sensors available on the market did not meet the needs at an adequate cost and that the best solution was to develop a proprietary luxometric sensor with an integrated GPS position sensor, as well as the corresponding data management software.
 LX-GPS
lux sensor requires specific performance characteristics, most notably its ability to closely resemble the human eye. To achieve this, and in collaboration with the UPC (Polytechnic University of Catalonia), the filters and diffuser needed for the chosen lux sensor were determined. Therefore, a unique diffuser with integrated filters was developed to adjust both the V-lambda curve and the cosine alpha.
Another important feature was the measurement range and accuracy, ensuring its use both day and night and enabling the analysis of the interaction between artificial lighting and weather conditions, such as in tunnel lighting. The LX-GPS thus has an average range of 0 to 50,000 lux and self-adjusting accuracy.
During the development of the lux sensor, it was decided that the most suitable approach would be direct data transmission to the computer without the need for an adapter or converter. Therefore, the sensor integrates the signal converter and provides the processed data. Furthermore, a USB connection was chosen for the direct transmission of illuminance data to any type of Windows computer (laptop, netbook, tablet, etc.). This connection, in addition to being fast, allows the probe to be powered with 5V, eliminating the need for additional cables.
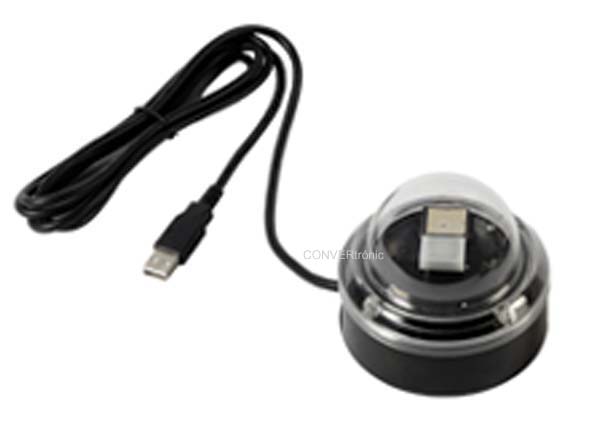
To solve the synchronization problem between the lux meter and the GPS, both have been integrated within the LX-GPS sensor (Figure 1), so that the lux meter and the GPS reader are controlled by the same microprocessor, using a single USB connection and protocol to communicate with the computer.
Thanks to the synchronous and adjustable-frequency updates of illuminance and position data, the system offers less positioning uncertainty compared to fixed-frequency systems, resulting in greater uniformity in measurement distribution. This enables data capture at maximum permitted speeds. Furthermore
, the need for a three-point parallel array average illuminance measurement system has been addressed with a USB port hub, and the software has been developed to record measurements from one to three LX-GPS sensors. This increases the overall accuracy of the system, both in illuminance assessment and position estimation. See Figure 2.
LX-GPS Software:
The main function of the measurement capture module is to read instantaneous illuminance and its corresponding GPS position. Measurements are recorded at regular intervals based on vehicle speed. This ensures that the intervals between measurements are approximately the same and that no measurement area has a higher concentration of measurements than others, which would distort the average value.
To aid in data capture, a screen displays the instantaneous value, in lux, for each of the up to three LX-GPS sensors that can be recorded simultaneously, as well as the average value of the three (Figure 3). Additional information is also displayed, such as GPS coverage, current position, number of available satellites, vehicle speed, distance traveled, etc.
 Regarding GPS position readings, it's important to note that if the GPS position is momentarily lost for any reason (underpasses, tunnels, etc.), the system can continue recording it until it is recovered. It then interpolates the positions from the measurements taken.
When viewing a task, we see a graphical representation of the illuminance measured in lux and the distance traveled in meters. In addition, there is a summary of the entire task, including the average illuminance and uniformity. We can also select an area of the graph, and the system will calculate the illuminance and uniformity values for that section, comparing these partial values with the values for the entire
task.
But we can not only analyze individual tasks, but also compare two tasks by visualizing their graphical representation (Figure 4). In addition to obtaining a summary of the illuminance and uniformity of each task, the percentage of variation between tasks is calculated.
In short, the LX-GPS sensor is a device specifically designed for this application and intended for mass production, guaranteeing its availability and cost-effectiveness.
The LX-GPS system philosophy is to be a standard tool, not a one-off solution, and therefore it will continue to evolve and enhance its capabilities. This is especially true regarding the data analysis software, which will incorporate new features such as visualization and mapping of the tasks.
Author:
Carlos Sierra Garriga, ETSEIB-UPC; Rubén Sanz Ciria, ETSEIB-UPC;
Carlos J. Vives Nebot; AFEISA