

 Introduction: Power Design Under Pressure
In recent years, the typical product design cycle has shortened; at the same time, companies' product offerings have increased in number and become better tailored to different applications. Today's design teams must also dedicate a growing amount of resources to achieving compliance. These added demands are often met at the expense of the power stage design, which involves electrical and thermomechanical challenges and often requires intensive laboratory work.
Faced with a lack of options for evaluating new designs that utilize the most advanced power devices, designers may be tempted to resort to a known and approved solution that uses older, less efficient devices. This can affect the final product, for example, by requiring a relatively large and expensive heatsink that could be reduced or even eliminated by using newer designs based on more modern power semiconductor technologies.
Application-oriented tools:
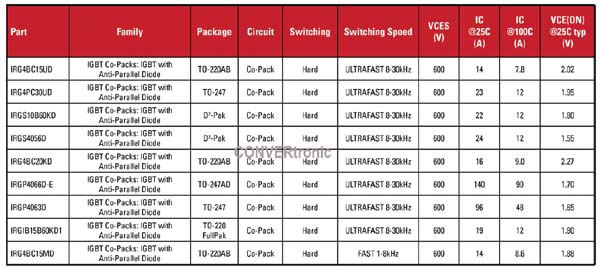
Online design tools can potentially help streamline power stage design, but basic web-based device selectors have limited value. A typical example, such as the one shown in Figure 1, indicates a set of key parameters but makes no mention of the thermal environment or operating frequency.
IR's next-generation web-based tool, introduced in 2011, provides a valuable advancement by enabling the analysis of critical application parameters such as temperature and frequency. In earlier versions, a background engine calculated the junction operating temperature under various simple but representative working conditions. The latest version further narrows the gap between the thermal environment and the device itself, and provides enhanced functionality that allows for accounting for heatsink thermal resistance as well as the thermal resistance of surface-mount devices.
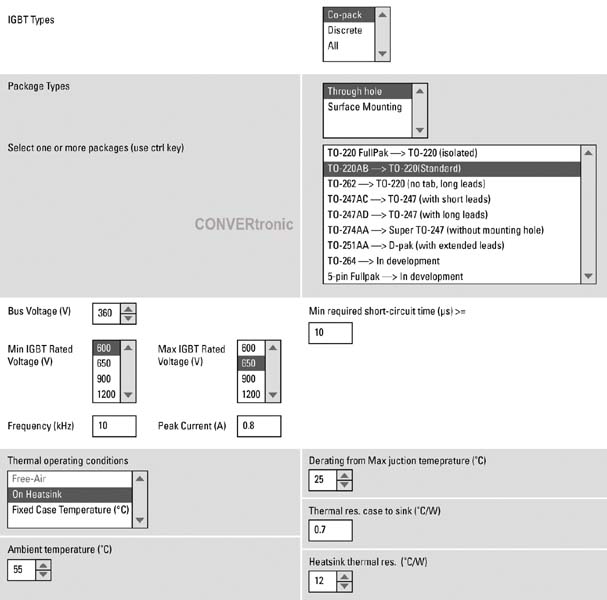
Between Figure 2 and Figure 6 you can see how the tool can help evaluate various alternative IGBTs and design techniques when creating a small motor drive for an application such as a household appliance.
The package characteristics and electrical operating conditions are entered in the appropriate windows, including the standard 10µs short-circuit time requirement. A heatsink bracket that connects to the three-phase bridge is specified, and its thermal resistance of 12°C/W is entered.
The tool uses this data to calculate power losses under the specified application conditions. Only devices operating at a junction temperature below a preset limit are accepted as potential candidates. The temperature limit is equal to the maximum junction temperature minus the reduction entered in Figure 2. It is important to remember that the power loss and temperature figures are not absolute and should only be used to compare potential candidates.
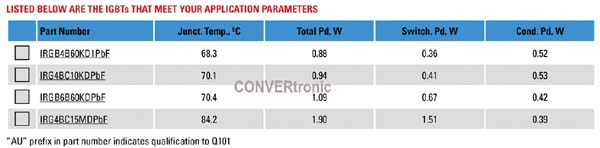
The IGBTs that meet the requirements introduced in Figure 2 are the four shown in Figure 3. They are ordered according to the junction operating temperature, which is of course closely related to efficiency.
The tool can be used to explore alternative solutions, such as surface mounting without a heatsink. The design is revised to specify a DPAK package for surface mounting and a thermal resistance to ambient of 40°C/W. This represents a board with 4-6 oz copper laminate and connections under the IGBTs. The remaining operating conditions are the same.

This time the tool indicates the two IGBTs shown in Figure 4. The power dissipation is close to that of the IGBTs in Figure 3, but since the package and semiconductor die are smaller, the DPAK devices are expected to be less expensive. The junction temperature may be slightly higher, but it remains within the limits of the junction and the printed circuit board's capacity.
Reducing the short-circuiting requirement from 10µs to 5µs (perfectly within the response time of typical current-sensing ICs) may help identify other suitable devices that can be adapted to this application.
This time, the tool indicates the same two IGBTs shown in Figure 4, plus a new one (Figure 5) that reduces power dissipation and junction temperature. Unsurprisingly, this more efficient IGBT is the new trench-type device, while the other two are flat-type.
The latest version of the tool, which has just been released, allows engineers to take a step further in their analysis by comparing the relative performance of candidate IGBTs, thus gaining a better understanding of their capabilities.
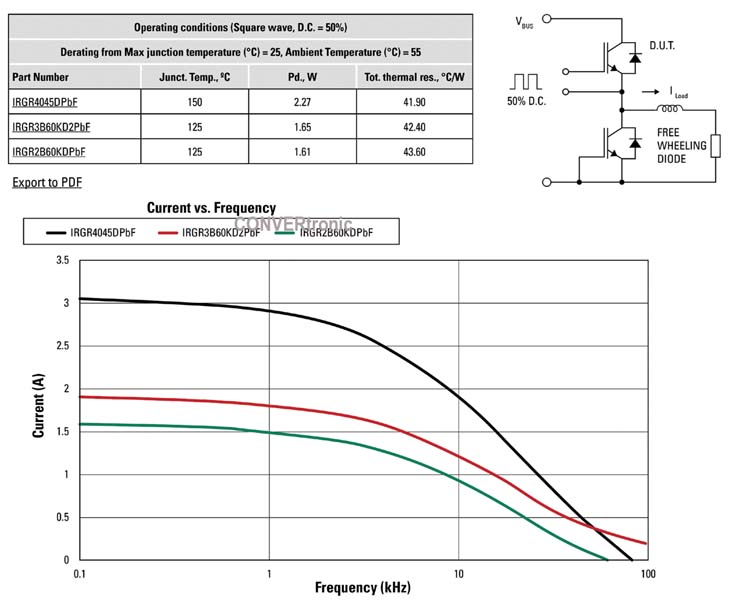
The graph shown in Figure 6 is generated by selecting each reference number in the left-hand window and clicking the "Current vs. Frequency Chart" button. The current and frequency values were established in the previous figures. Note that in this graph, the junction temperature remains constant despite variations in temperature and current; this is the final result.

Design Refinement
As shown in Figure 6, the tool clearly demonstrates that the IRGR4045 exhibits superior driving characteristics compared to the other two IGBTs, as it can conduct significantly more current at lower frequencies. It is also evident that the current-carrying capacity degrades much more rapidly with increasing frequency, indicating higher switching losses. As experienced designers know, high switching frequencies can lead to EMI problems rather than tangible benefits, particularly in motor drives.
The table also provides clues to the junction operating temperature and power dissipation. The graphs correspond to a junction temperature that is 25°C lower than the maximum value, based on the data entered on the first screen. The IRGR4045 has a nominal temperature of 175°C, while the others have a nominal temperature of 150°C. This is one reason why the IRGR4045's curve is much higher than the other two.
In practice, printed circuit board limitations would prevent the sample motor drive from taking advantage of the IRGR4045's higher nominal temperature. However, as can be seen in Figure 5, the IRGR4045 has the lowest operating temperature for this application. This provides another clue for optimization: eliminating on-board connections and using 4-ounce copper can reduce the bill of materials cost. The effects on losses and temperature can be confirmed by going back to the device selector, increasing the thermal resistance from 40°C/W to, say, 50°C/W, and checking the results.
This example demonstrates that the new version of this web tool is more effective than previous versions in helping designers evaluate the performance of their feeding systems and optimize designs from the point of view of cost, efficiency, and reliability.
Future Tools:
The most advanced web-based power design tools could still see further improvements. IR has identified two main areas in this regard. One involves obtaining a more representative calculation of the converter's duty cycle and losses. In the schematic of Figure 6, the losses are calculated for a buck converter operating at a 50% duty cycle in DC mode. In this operating mode, the diode encapsulated with the IGBT does not conduct. The complementary diode does not conduct, and its losses are not calculated.
The calculated junction temperature for the upper device remains formally correct because its diode does not conduct, but the calculation is not representative of a real-world application because the duty cycle could be higher or lower, and the losses would vary accordingly.
To overcome this limitation, IR began developing application-specific tools. This offers the opportunity to account for additional factors, such as the effects of different modulation strategies and the fact that an IGBT in a motor drive only conducts during half of the motor current cycle, while its diode conducts during the other half. A tool specifically developed for motor drives would take all these factors into account while also considering the thermal environment. This tool would calculate the duty cycle based on the modulation index and power factor entered by the user.
The second improvement relates to the fact that the thermal environment cannot be accurately characterized by thermal resistance figures, since heat does not flow linearly from point to point but circulates in all directions depending on the temperature differential. There is no single "heatsink temperature" or "junction temperature"; instead, there is a temperature distribution across the surface of a junction and a 3D temperature distribution within the heatsink.
The analytical tools needed to accurately model a thermal environment are already available in the form of FEA engines that can be incorporated into the tool. The challenge lies in creating a suitable set of heat sink models. These models are developed in particularly demanding sectors such as the automotive industry. The way forward is to standardize these models and make them more useful for general-purpose applications.
Conclusion:
New generations of power semiconductors can help reduce the size and overall cost of solutions while simultaneously offering higher levels of reliability and efficiency. However, these constraints can prevent designers from exploring new opportunities and encourage the reuse of older designs. The consequences are suboptimal performance in the final product. The latest generations of web-based tools are effective in accelerating power design and helping engineers leverage cutting-edge technologies in new product designs.
Author:
Steve Clemente, Chief Technologist, International Rectifier Corp.