

Introduction
In applications requiring low leakage current, it is important to select an operational amplifier with a low input bias current (IB). Application Note AN-1373 explains how to measure an ultra-low bias current using the ADA4530-1 evaluation board. However, when dealing with femtoampere (fA) level currents, the measurement environment (devices, shielding, cables, and connectors, among others) also affects the measurement results.
This article presents a setup that recreates the AN-1373 measurement using commercially available laboratory equipment, devices, and materials, and also offers some solutions for improving the measurement to achieve 50 fA. First, we measure the input capacitance to determine the bias current and the variation of the output voltage with the input capacitance loaded at 125°C. We also attempt to obtain the bias current value from the measured output voltage. Finally, we tried to improve the measurement environment based on the results.
Capacitive Integration Measurement
According to AN-1373, the input capacitance (Cp) of the ADA4530-1 must first be measured in order to use the integral capacitance measurement method. We will perform this experiment using the ADA4530-1R-EBZ-BUF with the ADA4530-1 configured in buffer mode.
Next, we calculate the input current (IB+). Specifically, using the circuit configuration shown in Figure 1, when the switch in the test box transitions from ON (grounded) to OFF (open), IB+ flows into Cp. The output voltage increases as IB+ charges Cp, so the value of IB+ can be calculated by monitoring it and substituting it into Equation 1.
 Figure 1. Diagram of the capacitive integration measurement method.
Measuring the total input capacitance with an input series resistor
To calculate Cp, this experiment uses a method with an input series resistor. Figure 2 shows a simplified circuit diagram. The series resistance value is based on the measurement guidelines on page 6 of AN-1373, and the actual value is Rs = 8.68 MΩ. A switch is also mounted on the test box for later experiments (the switch is currently open).
The frequency at which the function generator's waveform attenuates to -3 dB can be measured, and the input capacitance can be calculated using Equation 2.
 Figure 2. Calculation of Cp with an input series resistance.
Figure 3 shows the setup. Since the temperature in the temperature-controlled chamber rises to 125°C in the experiment described in the section "How to Measure IB+ with a Known Input Capacitance" (page 6 of AN-1373), we used materials that can withstand this temperature. RG-316U was used for the coaxial cable. Furthermore, the non-inverting inputs of the ADA4530-1 on the evaluation board are triaxial connectors. For this reason, a triaxial-to-coaxial conversion connector (BJ-TXP-1 from Axis Company) was used. In this configuration, the protection terminal was left floating on the triaxial side.
The measurement yielded Cp = 73.6 pF, a relatively large value given that the actual measurement, according to AN-1373, is approximately 2 pF. The reason for this is related to the length of the cable between the test box, which resembles a test board, and the non-inverting input.
 How to Measure IB+ with a Known Input Capacitance
Finally, we begin measuring the bias current. The circuit setup is shown in Figure 1, and the test box is shown in Figure 4. Note that the input resistor used in the section “Measuring Total Input Capacitance with an Input Series Resistor” has been eliminated. As explained in AN-1373 (the capacitive integration measurement method, page 7), the switch is shorted to ground, then opened, and the output voltage fluctuation is monitored with a digital multimeter for a few minutes (we used the Keysight Technologies 34401A). Finally, we calculate IB+ by substituting VOUT into Equation 1.

The results of the three measurements under the same conditions are shown in Figure 5. The lower portion of the figure shows the output voltage fluctuation of the ADA4530-1 as measured by the digital multimeter, and the upper portion shows the current value calculated using Equation 1. The figure demonstrates that in all three cases, the measured voltage values are not repeatable. Therefore, the waveform of the calculated current value also differs from the result described in AN-1373.
Figure 4. Capacitive integration measurement setup.
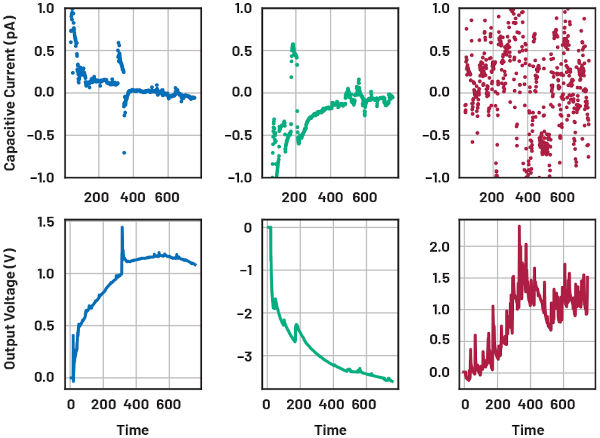 Figure 5. Measurement results. The bottom part shows the output voltage of the ADA4530-1 measured by the digital multimeter, and the top part shows the current value calculated using Equation 1. The blue line is the first measurement, the green line is the second measurement, and the red line is the third measurement.
How to Improve the Measurement Environment
In the “Capacitive Integration Measurement” section, we measured IB+ using AN-1373 as a reference, but the results differed. In this section, we outline the steps to improve the measurement environment and, therefore, the accuracy of the measurements.
Installing a Shielded Enclosure and Shortening the Input Cable
First, we added these two improvements:
• A shielded enclosure was installed on the evaluation board inside the thermostatic chamber (see Figure 6).
• The coaxial cable connected to the non-inverting input terminal was shortened to reduce Cp (see Figure 7).
The first improvement was intended to reduce the effect of external noise, and the second to reduce the small leakage current in the cable (the recalculated Cp is 35.2 pF). However, although these measurements were taken and repeated, reproducibility was not observed, similar to the results obtained in “Capacitive Integration Measurement.” The waveforms differed significantly from the expected values.
 Figure 6. Installation of the shielded enclosure.
Removing the Test Box:
The test box was removed, and the switch was changed by shorting and directly opening the ground connection (see Figure 8). In other words, the conductance component called the test box was removed, and the measurement was taken. As a result, we were able to obtain the waveform shown in Figure 9.
The output voltage measured by the digital multimeter increased following a constant slope and reached approximately 4.16 V in all measurements. The corresponding current indicates a value of approximately 50 fA.
 Figure 7. Shortening of the coaxial cable.
Figure 8. Measurement after removing the test box. The short-circuiting and opening of the circuit is performed manually, not with the switch.
Furthermore, the red line in Figure 9 shows the waveform of the new measurement with a shorter coaxial cable connected to the non-inverting input terminal (Cp = 26.5 pF). The increase in the voltage slope is as large as the theoretical calculation. From these measurement results, it can be observed that the conductance component in the input stage has a significant adverse effect on the accuracy of the measurement.
Figure 9. Measurement results after removing the test box. The blue, orange, and green lines are the measurement results at Cp = 35.2 pF. The red line is the measurement result when Cp = 26.5 pF.
Conclusion:
While fA level measurement can be performed in a general laboratory setting, special attention must be paid to the leakage current path in the operational amplifier's input stage.
To improve measurement accuracy, it is recommended to use a Teflon strip in the input stage or a triaxial cable in conjunction with the evaluation board.
Acknowledgments:
The author wishes to thank Scott Hunt, Iku Nagai, and Jun Kakinuma for their technical advice.
Reference:
Wong, Vicky. “AN-1373 Application Note: ADA4530-1 Femtoampere Level Input Bias Current Measurement.” Analog Devices, Inc., October 2015.
About the author
Aoi Ueda joined Analog Devices Japan (ADKK) in 2021 as a Field Applications Engineer in the Instrumentation Group. She holds a Master of Engineering degree from the Nara Institute of Science and Technology (2021) and a Bachelor of Science degree from the National Institute of Technology at Nara University (2019). She is a Japanese otaku idol. Her email address is