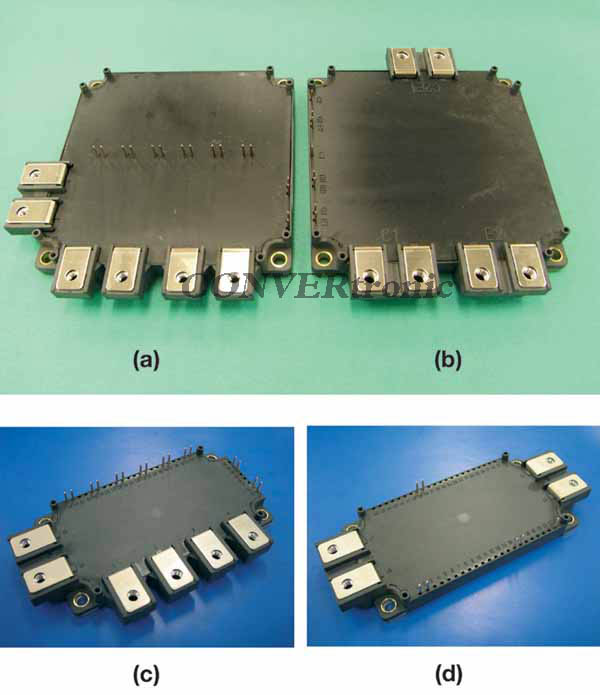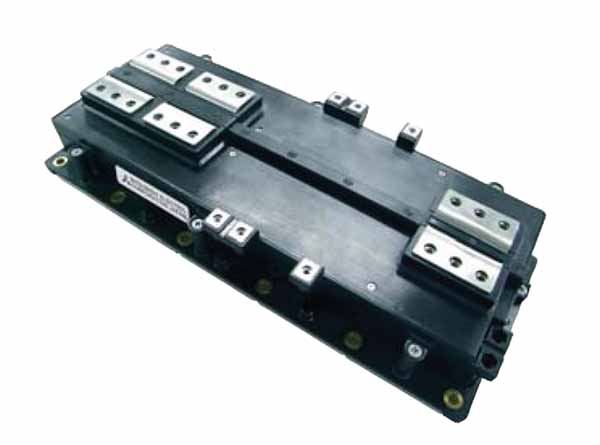



Figure 1.
1. Introduction
Adjusting the EMI performance of a system is a complex task, as the influencing parameters are numerous and require detailed investigation.
Thus, changing a power unit or stage of a UPS, for example, by upgrading a power semiconductor module is a time-consuming task. The study carried out in this document is limited to the gate driver and its trade-off between dv/dt and, specifically, the switching power loss. By analyzing the dependence of the switching behavior, especially dv/dt, as a function of the gate resistance on the one hand, and the IGBT loss being highly influenced by the choice of gate control conditions on the other, a relationship can be established between the IGBT loss and the potential EMI behavior. The investigation results in a graph showing the switching power loss, the gate resistance, and the switching voltage rate (dv/dt).
Furthermore, a compact evaluation platform, the "Evaluation Board," comprising the isolated IGBT driver and DC/DC converter for operating the 6-in-1 IGBT module equipped with a state-of-the-art CSTBT™ and a flyback diode (FwDi), is presented and analyzed using thermography. Initially, switching tests using multi-pulse generators were conducted under the presumed worst-case conditions. While switching loss is generally worse in cases of high DC bus voltage combined with high collector current and high junction temperature of the device under test, dv/dt behavior, in contrast, is more severe at ambient temperature and low currents. Applications such as motor controllers and Uninterruptible Power Supplies (UPS) are subjected to all these different conditions during operation, for example, from cold starts to operation with high loads and their corresponding high junction temperatures.
2. Testing the configuration and parameters
2.1 Power loss in connection (Eon)
All measurements to characterize the power loss in connection were carried out on a 6-in-1 150 A/1200 V IGBT module. The loss measurement only requires 1 phase of the module. The test configuration is shown in Figure 1, while the conditions of this test are mentioned in Table 1.

The measured switching energies are a consequence of the integrated instantaneous power loss within the specified time limits of 10% of the switching current and 10% of the applied Vcc supply voltage. Figure 2 indicates these limits.
2.2 dv/dt Measurement
The acquisition of dv/dt information is performed at a specification point where the highest dv/dt values are expected, as mentioned in the introduction, for example, at low currents and comparatively cool temperatures.
This worst-case scenario was determined to be 10% of the IGBT's rated current and a DC link supply voltage of 600 VDC. In fact, the RBSOA of the sixth-generation CSTBT™ chipset would cover up to 850 V, but for the sake of many motor control applications supplied without active input, the value of 600 VDC was chosen. All control conditions are shown in Table 2.
The test circuit originally proposed in Figure 1 for turn-on power has been modified to keep the device under test "non-floating." This modification of the test setup allows the oscilloscope to be kept at a stable, non-floating potential. The test setup used for dv/dt measurement is shown in Figure 3.
3. Evaluation Platform
3.1 Evaluation Board Design
These tests can be performed using a dedicated evaluation board (EVB) as shown in Figure 4.
The 2-PCB solution shown in Figure 4 illustrates the construction of this evaluation board: an integrated IGBT driver circuit with desaturation detection is located on top of the IGBT module, and the isolated DC-DC converter is used for each IGBT on the second board, located on top of the gate driver board. The gate resistors can be selected from the entire recommended range of IGBTs available in this package, and the designed DC-DC converter covers the full range of 6-in-1 IGBT modules using 6th generation CSTBT™, taking into account switching frequencies up to 20 kHz.


Figures 2a and 2b: Integration interval of the switching loss as a consequence of the ignition switching energy (Eon).
Safety isolation between the control inputs and the IGBT output has been achieved by the photocoupler and reinforced isolation of the DC-DC converter.
3.2 PCB Design
Furthermore, the design of this evaluation platform becomes critical due to space limitations that affect achievable clearance and creep distances. As shown in Figure 4, the evaluation board actually consists of two PCBs mounted one on top of the other and interconnected by pin headers.

The PCB near the IGBT module contains the electrical isolation for the input stage and the gate driver circuitry itself, while the PCB above the gate driver circuitry contains the DC-DC converter supplying power to the individual gate driver circuits for each channel. The estimated power consumption per channel is derived from the (comparatively small) gate load of the 6th generation CSTBT™ used at the specific gate voltage levels for turn-on and turn-off, respectively, and a range of possible switching frequencies.
Calculating the required gate driver power stage for the largest available module in a 6-in-1 configuration, for example, a 150 A/1200 V device, at a maximum switching frequency of 15 kHz, and considering a positive bias of 15 V and a negative bias of 8 V, will result in a power requirement of approximately 1 W per driver channel.
In a conservative approach, the DC-DC converter, implemented in a push-pull topology, has been designed to deliver 1.5 W per channel of the IGBT driver. Having previously mentioned the difficulty of providing sufficient clearance and creep distances, it turns out that despite the small surface area of the IGBT package and the complexity of the pin arrangement, it is possible to achieve approximately 5.5 mm of clearance and creep on the IGBT driver board. The design of the DC-DC converter reveals further challenges.

Figure 3.
Once large EE-13.5 cores and primarily wire-mounted (THT) components were selected for the first prototype DC-DC converter evaluation board, the achievable clearance distance was limited to only about 3.5 mm. A future revision of this board aims to achieve 5.5 mm or more clearance and creeppage distances, enabling the use of this platform in high-contamination environments. Given the ample power of this SMPS design, the clearance and creeppage targets can be achieved by adjusting the SMPS power and selecting smaller ferrite core sizes, as well as using surface-mount components to stabilize the positive and negative biases of the gate driver voltages. The DC-DC converter PCB also contains a circuit to transfer temperature information from the NTC thermistor embedded in the IGBT module housing, via a safety isolation barrier, to the control pin header at the top of the board. In addition to the electrical performance evaluation, the thermal performance of the DC-DC converter was analyzed.

Figure 4: EVBNX 6-in-1 and its 2-PCB solution. Bottom: IGBT driver, top: DC/DC converter

Figure 5: Two adjacent IGBT controllers on the controller board and the creepage distance.

Figure 6: Thermal image of the DC-DC converter
3.3 Electrical and Thermal Evaluation
The DC-DC converter and the performance of the controller's loss stage were evaluated during the design phase using simulation. A thermal evaluation and verification were carried out on the first prototype to demonstrate previous theoretical results. An IR camera image of the DC-DC converter under (over)load, for example, 1.5 W per IGBT channel with all 6 channels operating, is shown in Figure 6. The image was taken after thermal equilibrium was reached at an ambient temperature of 21°C. The entire surface was painted black, providing a uniform emissivity of 0.99 for the entire PCB and its mounted components. Five reference points were chosen for this analysis, as shown in Figure 5. While the results of the maximum load operating conditions are more relevant in thermal evaluation results, an electrical evaluation of an SMPS must also consider the full load range, for example, from 0% to 100% (150%) of the load, to test the sufficient stability of the supplied voltage. The thermal image shows that many small transformers are used in parallel in this test design, and therefore the balance of secondary voltages must also be considered.
The SMPS closed-loop control yielded satisfactory results, with small and acceptable voltage variations across the entire load range. However, the rather heterogeneous temperature of the board, as revealed in Figure 6, requires further analysis.
This reference point in thermal image #5, the point furthest from the heat sources, contains the PCB's base temperature information.

Figure 7: “trade-off” between Eon and dv/dt as a function of gate resistance loss (based on measurement of sample “ES”)
The indicated points are assigned to numbers 1 to 5 and correspond to the following stages of the DC-DC converter indicated in Table 3.
The reference point with the highest temperature of 70.8°C is 49.8K above ambient temperature.
A more in-depth analysis should be performed on the components with the highest encapsulation temperatures, as shown in Figure 6. Considering the individual losses of the marked components and calculating the internal temperature rise using the individual thermal resistance Rth (jc) of each component allows for an assessment of the design's safety and reliability. The highest junction temperature is found in reference number 4, for example, in the gate positive voltage stabilization circuit.
In this case, the highest temperature measured on the surface corresponds to the highest calculated junction temperature. The DC-DC converter solution provides a thermally stable design, even under approximately 1.5 times the overload, and reveals headroom that could be used to make the design more compact or to increase the maximum permissible ambient temperature of the evaluation platform.
 4. Results
The compiled results of the power loss-in-connection (Eon) and dv/dt tests are shown in the graph in Figure 7 below. The dv/dt and Eon results are shown together in this figure, which uses the gate resistance values as a parameter. In addition to EMI, dv/dt is also considered to have an impact on winding aging. EMI, besides the IGBT/FwDi and its switching speed as a source, is also influenced by propagation mechanisms such as capacitive coupling. An IGBT module upgrade implies that the EMI/EMC propagation basically remains unchanged, except in the internal construction of the module. The new proposed modules all use aluminum nitride (AlN) as a substrate, which allows for a reduction in the coupling capacitance between the footprints and the collector sides of the chips to ground, increasing the substrate thickness compared to conventional Al2O3. To provide a reference for the Eon versus dv/dt results of a standard industrial module without this new 6th generation CSTBT™ and FwDi, the results are also shown in Figure 7. In comparing these two different technologies, the module with the 6th generation chip offers a better trade-off between dv/dt and power loss at the specific connection. Therefore, a superior chip solution maintains a certain dv/dt level compared to a standard industrial solution. The range of dv/dt settings in inverters will depend on the final application of the power stages. Applications with a dedicated output filter operate at higher dv/dt levels compared to motor control applications.
Especially for motor control applications, typical dv/dt values can be observed at less than 8kV/s and generally much closer to 4kV/s.
5. Conclusion
The study on a 6-in-1 IGBT module equipped with the new tested chipset and a new FwDi has demonstrated superior switching loss relative to dv/dt performance compared to previous generations of IGBT modules.
This improved trade-off leads to better-performing controllers, or in turn, to a potential cost advantage due to reduced EMI filtering.
Author:
Marco Honsberg*, Thomas Radke*, Kazufumi Ishii**, Jokou Manotobu**
* Mitsubishi Electric Europe BV, Germany
** Mitsubishi Electric Corporation PDW, Fukuoka, Japan
6. Bibliography
1. Yamada, M. Nakamura et al.: the latest high performance and high reliability IGBT technology in new packages with conventional pin layout, PCIM 2003, pp. 329-334
2. M. Iwasaki, M. Seo, T. Iwagami, H. Sakata, M. Honsberg, “A New Miniature Package DIPIPM with Optimized EMI Performance For Home Appliances”, PCIM Europe 2001
3. T. Ohi et al.: Novel over current protection methods for IGBT drivers using gate voltage monitoring, EPE 2003
4. Lawrence. Curran: Switching Power Supplies, EDN, pp. 19-23, Feb 2001
5. Mark I. Montrose: Printed Circuit Board Design Techniques for EMC Compliance, Wiley-IEEE Press Series on Electronics, June 6. Skuriat, R., Johnson, CM: Thermal Performance of Baseplate and Direct Substrate Cooled Power Modules, 4th IET conference on PowerElectronics, PEMD, York, 2008